
Ultraviolet–visible spectroscopy or ultraviolet–visible spectrophotometry (UV–Vis or UV/Vis) refers to absorption spectroscopy or reflectance spectroscopy in part of the ultraviolet and the full, adjacent visible spectral regions. This means it uses light in the visible and adjacent ranges. The absorption or reflectance in the visible range directly affects the perceived color of the chemicals involved. In this region of the electromagnetic spectrum, atoms and molecules undergo electronic transitions. Absorption spectroscopy is complementary to fluorescence spectroscopy, in that fluorescence deals with transitions from the excited state to the ground state, while absorption measures transitions from the ground state to the excited state.
The energy levels involved in transitions in the UV-visible region are the electronic levels of atoms and molecules. For example, although light atoms have widely spaced energy levels, some heavy atoms have their outer orbitals close enough together to gives transitions in the visible region. This accounts for the colors of iodides. Transition metals, having partly occupied d or f orbitals, often show absorption bands in the visible region.
Principle of Ultraviolet–Visible Absorption
Organic molecules contain carbon-carbon bonds, and bonds between carbon and other elements such as hydrogen, oxygen, nitrogen, sulfur, phosphorus and the halogens. Single bonds correspond to the bonding s orbital, which has an associated antibonding sigma* orbital. Multiple bonds may also be formed and correspond to the pie bonding and pie* antibonding orbitals. Bonding orbitals have lower energy, while antibonding orbitals have higher energy. Lone pair electrons on atoms such as oxygen are little changed in energy. Thus, a molecule such as propanone (acetone) has the structure:

The single C–H and C–C bonds relate to s orbitals, the carbonyl double bond to π orbitals and the unpaired electrons on the oxygen to the nonbonding n levels. The energy levels may be grouped approximately as shown in Figure 1. Transitions between sigma and sigma* levels, and between pie and pie* are favored, and those of the n electrons to the higher levels also occur.
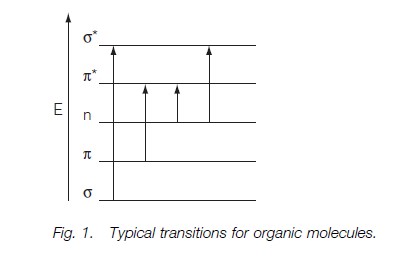
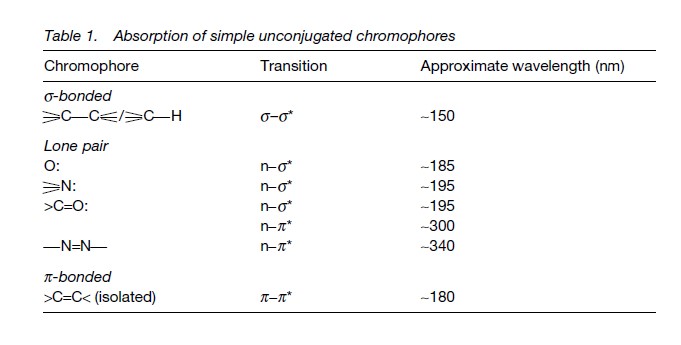
Figure 1 shows that the sigma-sigma* transitions require the largest energy change and occur at the lowest wavelengths, usually less than 190 nm, which is below the wavelengths measurable with most laboratory instrumentation. The pie-pie* transitions are very important, as they occur in all molecules with multiple bonds and with conjugated structures, such as aromatic compounds. The transitions occur around 200 nm, but the greater the extent of the conjugation, the closer the energy levels and the higher the observed absorption wavelength.
Transitions involving the lone pairs on heteroatoms such as oxygen or nitrogen may be n-sigma*, which occur around 200 nm, or n-pie*, which occur near 300 nm.
Some Important Terms in UV-Visible Spectroscopy
- Chromophore: A covalently unsaturated group responsible for electronic absorption (e.g., C=C, C=O, esters, amides, -NO2 etc.).
- Auxochrome: A saturated group with non-bonded electrons which, when attached to a chromophore, alters both the wavelength and the intensity of the absorption (e.g., -OH, -NH2, -NR2 -SH etc.)
- Bathochromic Shift: The shift of absorption to a longer wavelength (also known as “red shift”).
- Hypsochromic Shift: The shift of absorption to a shorter wavelength (also known as “blue shift”).
Applications of UV-Visible Spectroscopy
UV/Vis spectroscopy is routinely used in analytical chemistry for the quantitative determination of different analytes, such as transition metal ions, highly conjugated organic compounds, and biological macromolecules. Spectroscopic analysis is commonly carried out in solutions but solids and gases may also be studied.
Solutions of transition metal ions can be colored (i.e., absorb visible light) because d electrons within the metal atoms can be excited from one electronic state to another. The color of metal ion solutions is strongly affected by the presence of other species, such as certain anions or ligands. For instance, the color of a dilute solution of copper sulfate is a very light blue; adding ammonia intensifies the color and changes the wavelength of maximum absorption (λmax).
Organic compounds, especially those with a high degree of conjugation, also absorb light in the UV or visible regions of the electromagnetic spectrum. The solvents for these determinations are often water for water-soluble compounds, or ethanol for organic-soluble compounds. (Organic solvents may have significant UV absorption; not all solvents are suitable for use in UV spectroscopy. Ethanol absorbs very weakly at most wavelengths.) Solvent polarity and pH can affect the absorption spectrum of an organic compound. Tyrosine, for example, increases in absorption maxima and molar extinction coefficient when pH increases from 6 to 13 or when solvent polarity decreases.
The Beer–Lambert law states that the absorbance of a solution is directly proportional to the concentration of the absorbing species in the solution and the path length. Thus, for a fixed path length, UV/Vis spectroscopy can be used to determine the concentration of the absorber in a solution. It is necessary to know how quickly the absorbance changes with concentration. This can be taken from references (tables of molar extinction coefficients), or more accurately, determined from a calibration curve.
A UV/Vis spectrophotometer may be used as a detector for HPLC. The presence of an analyte gives a response assumed to be proportional to the concentration. For accurate results, the instrument’s response to the analyte in the unknown should be compared with the response to a standard; this is very similar to the use of calibration curves. The response (e.g., peak height) for a particular concentration is known as the response factor.
The wavelengths of absorption peaks can be correlated with the types of bonds in a given molecule and are valuable in determining the functional groups within a molecule. The Woodward–Fieser rules, for instance, are a set of empirical observations used to predict λmax, the wavelength of the most intense UV/Vis absorption, for conjugated organic compounds such as dienes and ketones. The spectrum alone is not, however, a specific test for any given sample. The nature of the solvent, the pH of the solution, temperature, high electrolyte concentrations, and the presence of interfering substances can influence the absorption spectrum. Experimental variations such as the slit width (effective bandwidth) of the spectrophotometer will also alter the spectrum. To apply UV/Vis spectroscopy to analysis, these variables must be controlled or accounted for in order to identify the substances present.
Woodward (1941) predicted λmax values only for the lowest energy transition (π – π*) from HOMO to LUMO.
Base values:
Base value for an unsubstituted, conjugated, acyclic or Hetero-annular diene 214 nm.
Base value for an unsubstituted, conjugated, homo-annular diene 253 nm
Increments for:
Each extra double bonds in conjugation + 30 nm
Exocyclic double bond (effect is twofold if the bond is exocyclic to two rings) + 5 nm
Substituent effect:
A. -OCOR or –OCOAr + 0 nm
B. Simple alkyl substituents or ring residue + 5 nm
C. Halogen (-Cl, -Br) + 5 nm
D. OR (R=Alkyl) + 6 nm
E. SR (R=Alkyl) + 30 nm
F. NR2 (R=Alkyl) + 60 nm
