
Infrared spectroscopy (IR spectroscopy or Vibrational spectroscopy) is the spectroscopy that deals with the infrared region of the electromagnetic spectrum that is light with a longer wavelength and lower frequency than visible light. It covers a range of techniques, mostly based on absorption spectroscopy. As with all spectroscopic techniques, it can be used to identify and study chemicals. An IR spectrum can be visualized in a graph of infrared light absorbance (or transmittance) on the vertical axis vs. frequency or wavelength on the horizontal axis. Typical units of frequency used in IR spectra are reciprocal centimeters (sometimes called wave numbers), with the symbol cm-1.
The infrared portion of the electromagnetic spectrum is usually divided into three regions; the near-, mid- and far- infrared, named for their relation to the visible spectrum. The higher-energy near-IR, approximately 14000–4000 cm-1 [0.7–2.5 μm (micro-meter) wavelength] can excite overtone or combination modes of molecular vibrations. The mid-infrared, approximately 4000–400 cm-1 (2.5–25 μm) is generally used to study the fundamental vibrations and associated rotational–vibrational structure. The far-infrared, approximately 400–10 cm-1 (25–1000 μm) has low energy and may be used for rotational spectroscopy and low frequency vibrations.
Theory
Infrared spectroscopy exploits the fact that molecules absorb frequencies that are characteristic of their structure. These absorptions occur at resonant frequencies, i.e. the frequency of the absorbed radiation matches the vibrational frequency. The energies are affected by the shape of the molecular potential energy surfaces, the masses of the atoms, and the associated vibronic coupling.
In particular, in the Born–Oppenheimer and harmonic approximations, i.e. when the molecular Hamiltonian corresponding to the electronic ground state can be approximated by a harmonic oscillator in the neighborhood of the equilibrium molecular geometry, the resonant frequencies are associated with the normal modes of vibration corresponding to the molecular electronic ground state potential energy surface. The resonant frequencies are also related to the strength of the bond and the mass of the atoms at either end of it. Thus, the frequency of the vibrations are associated with a particular normal mode of motion and a particular bond type.
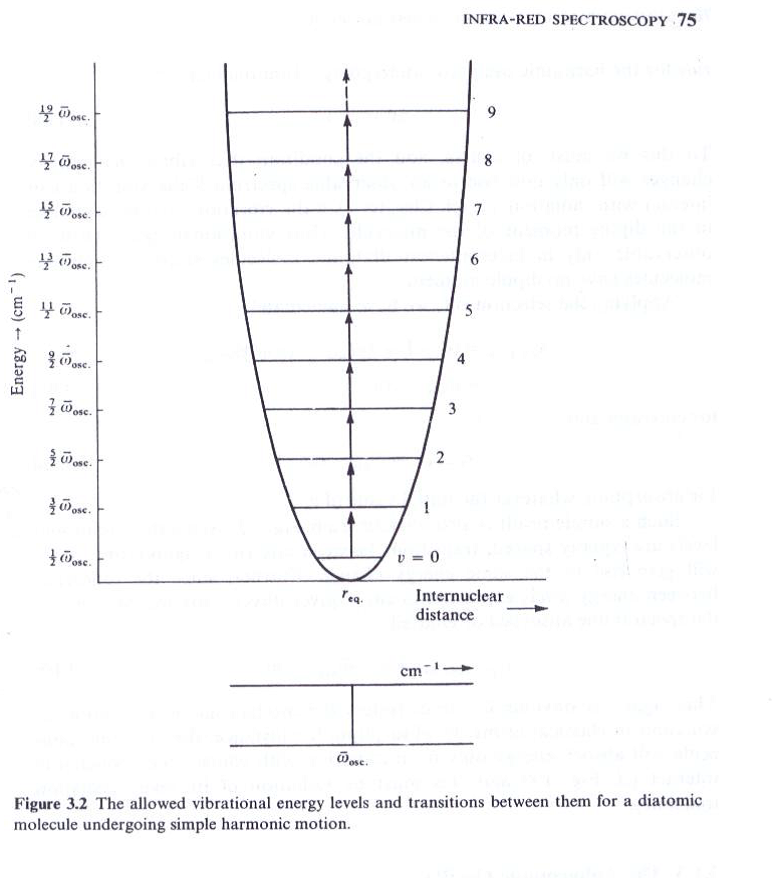
The Anharmonic Oscillator
The real molecules don’t obey exactly the laws of simple
Harmonic oscillator. The real bonds though elastic, not so homogeneous to obey Hooke’s law. If a bond between atoms is stretched continuously, then comes a point at which it will break- the molecule dissociates into atoms. Small compressions and extensions of a bond may be taken as perfectly elastic, but greater than 10% of the bond length behavior changes.

Condition: In order for a vibrational mode in a sample to be “IR active”, it must be associated with changes in the dipole moment. A permanent dipole is not necessary, as the rule requires only a change in dipole moment.
Number of Vibrational Modes
A molecule can vibrate in many ways, and each way is called a vibrational mode. For molecules with N number of atoms, linear molecules have 3N – 5 degrees of vibrational modes, whereas nonlinear molecules have 3N – 6 degrees of vibrational modes (also called vibrational degrees of freedom). As an example H2O, a non-linear molecule, will have 3 × 3 – 6 = 3 degrees of vibrational freedom, or modes.

The atoms in a CH2X2 group, commonly found in organic compounds and where X can represent any other atom, can vibrate in nine different ways. Six of these vibrations involve only the CH2 portion: two stretching modes (ν): symmetric (νs) and antisymmetric (νas); and four bending modes: scissoring (δ), rocking (ρ), wagging (ω) and twisting (τ)

The simplest and most important or fundamental IR bands arise from the excitations of normal modes, the simplest distortions of the molecule, from the ground state with vibrational quantum number v = 0 to the first excited state with vibrational quantum number v = 1. In some cases, overtone bands are observed. An overtone band arises from the absorption of a photon leading to a direct transition from the ground state to the second excited vibrational state (v = 2). Such a band appears at approximately twice the energy of the fundamental band for the same normal mode. Some excitations, so-called combination modes, involve simultaneous excitation of more than one normal mode. The phenomenon of Fermi resonance can arise when two modes are similar in energy; Fermi resonance results in an unexpected shift in energy and intensity of the bands etc.
Regions

- Functional Group region
The region above 1500 cm-1 is known as functional group region because the peaks of different functional groups appear on the spectrum above this frequency and can easily be detected. It becomes very easy to detect a functional group.
Carbonyl Group (C=O)
The carbonyl group gives a sharp peak in between 1500 – 1800 cm-1. The reason behind this large gap is that carbonyl group has many derivatives, it could be present in Ketone (RCOR), Aldehyde (RCOH), Ester (RCOOR), Carboxylic acid (RCOOH), Aryl halides (RCOX), Amide (RCONR2). So a slight change in the atmosphere of carbonyl group will change the IR frequency in the spectrum which could be due to number of factors:
Inductance or resonance effect
Dipole interaction through space
Conjugation effect
Solvent Effect
Hydrogen bonding
Carbon-Hydrogen Bond (C-H)
This bond can also be of many types depending on the neighboring atoms. It could be of alkyl, vinyl, aromatic, alkynes. The symmetric stretching peak of C-H bond comes between (2800 – 3200) cm-1. Alkynes give peak at higher frequency than vinyl and vinyl gives at higher frequency than alkyl. Aromatic C-H peak is closer to vinyl peak.
Alcohol Group (O-H)
The alcoholic group`s frequency varies between (3200-3600 cm-1). The reason behind the variation is Hydrogen bonding, more the hydrogen bonding in a molecule lesser will be the frequency as the O-H bond becomes slightly weaker.
A same scenario can be seen for (N-H) bond where Hydrogen bonding is also possible. Primary amines give peak between (3400-3500 cm-1), where ammonium ions give peak between (2400-3200 cm-1).
- Fingerprint Region
The region below 1500 cm-1 is called fingerprint region or the skeletal region. As the name indicates, just like no two humans can have same fingerprints, no two molecules will give same peaks at same frequency, hence the molecules can be detected easily.
Applications of IR Spectroscopy
Infrared spectroscopy is a simple and reliable technique widely used in both organic and inorganic chemistry, in research and industry. It is used in quality control, dynamic measurement, and monitoring applications such as the long-term unattended measurement of CO2 concentrations in greenhouses and growth chambers by infrared gas analyzers.
It is also used in forensic analysis in both criminal and civil cases, for example in identifying polymer degradation. It can be used in determining the blood alcohol content of a suspected drunk driver.
Infrared spectroscopy has also been successfully utilized in the field of semiconductor microelectronics: for example, infrared spectroscopy can be applied to semiconductors like silicon, gallium arsenide, gallium nitride, zinc selenide, amorphous silicon, silicon nitride, etc.
Another important application of Infrared Spectroscopy is in the food industry to measure the concentration of various compounds in different food products.
One more important application Of IR spectroscopy is that we also get rotational spectrum of the molecule because the Infrared radiations are stronger than microwave radiations.
1 comment for “Infrared Spectroscopy – Legendshub Blog”